





Key Takeaways
- The median landing page converts at 6.6% (Unbounce), so about 93 of every 100 paid visitors leave without converting.
- At the same ad spend, doubling your conversion rate halves your cost per conversion.
- The first screen gets the most attention: about 57% of viewing time sits above the fold (Nielsen Norman Group).
- Plain language and specific proof go with better results in the research below, and long forms and checkouts are a common reason people quit. Several of these findings are correlations, so test them on your own page.
- Speed pays: in a Google and Deloitte study, a 0.1 second mobile speed gain lifted retail conversions by 8.4%.
Have you ever paid for a click, watched the visitor land on your page, and then lost them in a few seconds?
You’re not alone. Unbounce analyzed more than 41,000 landing pages and 57 million conversions for its 2024 Conversion Benchmark Report. The median landing page converted at 6.6%.
Flip that around and about 93 out of every 100 people you pay for leave without doing what you wanted.
Most teams answer this by buying more traffic. That’s the expensive fix. The cheaper one is making sure the page deserves the clicks before you spend them.
That’s what a landing page audit is for. Below are 12 fixes worth making before you put ad budget behind a page, grouped into three parts: above the fold, trust and friction, and speed and measurement. Each one comes with the data behind it and a quick way to check your own page.
Why Fix the Page Before You Buy More Traffic
Your landing page sets the ceiling on what every ad dollar can do. Traffic is just the multiplier.
Here’s how conversion rates in Unbounce’s benchmark data change with where the visitor came from:
- Email: 19.3% average conversion rate
- Paid social: 12% (Instagram 17.9%, Facebook 13%)
- Paid search: 10.9% (Google 11.3%)
Those are averages, while the 6.6% figure earlier is the median across all industries. The report also says median rates for nine industries “range from 3.8% to 12.3%,” so check your own vertical before you judge your page.
Now look at what a conversion rate does to your cost. Here’s a hypothetical: you spend $5,000 and buy 5,000 clicks at $1 each.
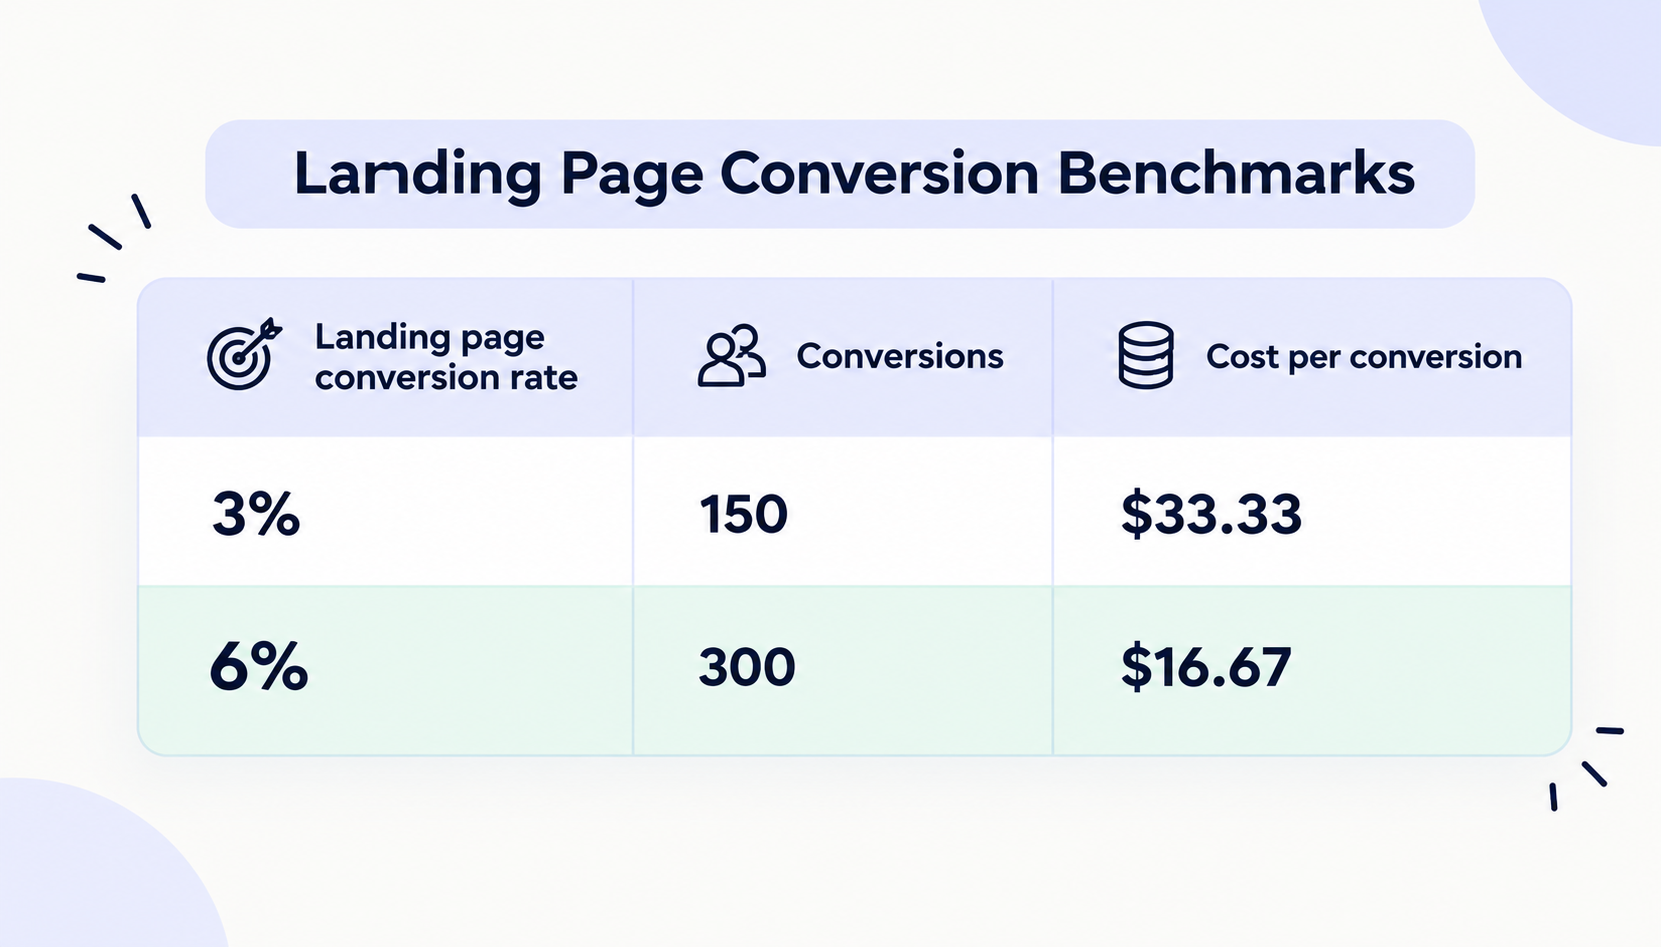
Same budget, same traffic, half the cost per conversion. You didn’t touch the bid.
One caveat. These benchmarks come from one company’s dataset, and your industry and traffic mix will differ, so treat them as a yardstick, not a promise. If your paid page converts well below them, the page is the first place to look.
How to Run the Landing Page Audit
An audit works best when it starts with numbers, not opinions. Before you change anything, set up the baseline.
- Pick one page. Choose the page that gets the most paid clicks right now.
- Record a baseline. Note the last 30 days of sessions, conversion rate and cost per conversion for that page, split by mobile and desktop.
- Put the ad next to the page. Open the ad or email that sends people there and look at both together.
- Score each fix. Use the scorecard below. A fix either passes or it doesn’t. No “sort of.”
- Write down the failures. You’ll rank them in the last section.
Here’s the scorecard. The rest of this guide explains each row.
| Sr.No | Fix | Quick check | Passes if |
|---|---|---|---|
| 1 | Match the ad | Open the ad and the page side by side | The headline repeats the ad’s promise in the same words |
| 2 | Clear headline | Show the page to a stranger for five seconds | They can say what you offer, who it’s for, and what to do next |
| 3 | One goal, one CTA | Count every button and link | Every button asks for the same action |
| 4 | Plain copy | Paste the text into a free readability checker | It reads at a 5th to 7th grade level |
| 5 | Specific proof | Look beside the CTA | Numbers, named customers or logos sit next to the button |
| 6 | Trust | Read the page as a skeptic | Real company details, guarantees and security cues are visible |
| 7 | Short form | Count the fields | Every field is something you need for the first follow-up |
| 8 | No exits | Count the links that leave the page | No menu and no competing offers |
| 9 | Fast load | Run the URL through PageSpeed Insights on mobile | Core Web Vitals are rated “good” |
| 10 | Mobile first | Open the page on a real phone | The headline and CTA show without scrolling, and buttons are easy to tap |
| 11 | Working tracking | Submit a test conversion | It shows up in analytics and the ad platform with the right source |
| 12 | A test queued | Check your testing log | One test with a hypothesis, a metric and an end date is ready |
Every “no” is a fix you can make this week.
Part 1: Fix What People See First (Fixes 1 to 4)
1. Match the page to the ad
Someone clicked because of a specific promise. If the page opens with something else, they have to work out whether they’re in the right place. That moment of doubt is exactly what you’re paying to avoid.
Check it: Put the ad and the page side by side. Compare the offer, the wording, the price or discount, and the image.
Fix it: Repeat the ad’s promise in the headline, in the same words. If three ad groups make three different promises, give each one its own page, or at least its own headline.
Example: For Black Friday, the discount in the ad should be in the first screen of the page, worded the same way.
2. Make the headline pass the five-second test
Where do people actually look? Nielsen Norman Group’s eyetracking research tracked more than 130,000 eye fixations from 120 participants. About 57% of viewing time was spent above the fold. In NN/g’s 2010 study, that figure was 80%.
Attention has moved down the page since then. Even so, the first two screens together drew 74% of viewing time, and NN/g’s advice is to reserve the top of the page for your key goals and keep major CTAs above the fold.
Check it: Show the page to someone who has never seen it for five seconds. Then ask three questions. What does this company offer? Who is it for? What would you do next?
Fix it: Say what it is and who it’s for in the headline. Say why it’s better in one line below it. Put one button under that. For example:
- Weak: “Powerful solutions for modern teams”
- Better: “Send invoices in minutes and get paid faster”
3. Give the page one goal and one CTA
A paid landing page has one job. Every extra choice is another place for the visitor to wander off: a second offer, a “learn more” link, a footer full of links.
Check it: Count every button and link on the page. Write down the action each one asks for.
Fix it: Pick one primary action and repeat the same button text every time it appears. Cut or demote everything else. If you need to serve two goals, like booking a demo and downloading a guide, build two pages.
4. Write at a reading level your visitor can skim
Plain language isn’t dumbing it down. In Unbounce’s benchmark data, pages written at a 5th to 7th grade level converted at 11.1%. That’s 56% higher than pages written at an 8th to 9th grade level, and more than double the 5.3% for professional-level writing.
The same report found that pages with more difficult words (three or more syllables) tended to convert worse. Two caveats: this is a correlation, not a controlled test, and the report says financial services is the only industry where more complex language can help.
Check it: Paste your copy into a free readability checker and note the grade level.
Fix it: Shorten sentences, swap “utilize” for “use,” lead with the benefit, and cut anything that doesn’t help the visitor decide.
Part 2: Earn Trust and Remove Friction (Fixes 5 to 8)
5. Put specific proof next to the button
Proof matters most at the moment someone decides. Northwestern’s Spiegel Research Center looked at how reviews affect buying. In data from a high-end gift retailer, the purchase likelihood for a product with five reviews was 270% greater than for a product with none.
Most of the gain came early. Nearly all of the lift happened within the first 10 reviews, and the first five drove most of it. The same research found that no category’s best-performing rating was a perfect 5.0, so there’s no need to hide your honest 4-star reviews.
One caveat. This is 2017 ecommerce research on product pages, and the 270% figure comes from a single retailer’s data. The idea carries over to service pages. The exact numbers won’t.
Check it: Look at what sits next to your main button. Is there a number, a named customer or a logo?
Fix it: Use specific proof: a result with a number, a named customer with a photo, or logos people recognize. On a brand-new landing page, pull in a real testimonial or a customer count you can back up. Never invent proof. It costs you the trust you were trying to earn.
6. Close the trust gap
Companies tend to think visitors trust them more than visitors do. In NP Digital’s June 2026 survey, 46% of companies believed visitors trust their site when they land on it. Only 23% of visitors said they did.
The survey covered 100 businesses with at least $10M in annual revenue, and the page doesn’t say how many visitors responded. Read it as a signal, not a precise number.
Trust shows up in checkout behavior too. In Baymard Institute’s list of reasons shoppers abandon carts, 19% said they didn’t trust the site with their credit card information.
Check it: Read your page like a skeptic. Who is behind this? Can you find a real company name, a way to contact them, pricing and refund terms without hunting?
Fix it: Add real company details, a clear guarantee or refund policy, and security cues near forms and payment fields. Trust is also design. Consistent typography and spacing, and real photos over stock, make a page look like a real company stands behind it.
7. Cut the form down
Every field asks the visitor to do work. Baymard found the average US checkout shows 14.88 form fields by default, while an ideal flow can get by with 7 to 8. Its list of abandonment reasons includes 18% who said the site wanted them to create an account, 17% who said the checkout was too long or complicated, and 17% who said the website had errors or crashed.
That’s checkout data, not lead forms. The logic travels anyway: each field is a reason to quit.
Check it: Count your fields. For each one, ask: do we need this to follow up?
Fix it: Keep what you need for the first follow-up and collect the rest later. Don’t force account creation. Test the form on a real phone before you launch, because a broken form fails silently.
8. Remove the exits
A navigation menu helps on a homepage. On a paid landing page it’s a row of exits.
Check it: Count every link that leaves the page, including the header, footer and links inside the copy.
Fix it: Remove the main menu, keep the logo, and keep only the footer links you need, such as your privacy policy. There isn’t a clean benchmark for this one, so if you’re not sure, treat it as a test (see Fix 12).
Part 3: Speed, Mobile and Measurement (Fixes 9 to 12)
9. Make it load fast
Three separate studies point the same way:
- Google and Deloitte: In Milliseconds Make Millions, a study of 37 brands and 30 million sessions over four weeks in late 2019, a 0.1 second improvement in mobile site speed lifted retail conversions by 8.4% and travel conversions by 10.1%. Retail order values rose 9.2%.
- Portent: In an analysis of just over 100 million page views across 20 B2B and B2C sites, Portent found that a site loading in one second had an e-commerce conversion rate 2.5x higher than one loading in five seconds. For B2B it was 3x.
- Vodafone: In an A/B test on a landing page, Vodafone improved its Largest Contentful Paint (LCP) by 31%. Sales rose 8%, the lead-to-visit rate rose 15% and the cart-to-visit rate rose 11%.
None of these is a guarantee for your page. The Google study covered mobile web only and is from 2019, and Vodafone’s result comes from one large test.
For a target, Google’s Core Web Vitals say LCP should happen within 2.5 seconds, Interaction to Next Paint (INP) should be 200 milliseconds or less, and Cumulative Layout Shift (CLS) should be 0.1 or less, measured at the 75th percentile of page loads.
Check it: Run your URL through PageSpeed Insights on mobile and look at the three Core Web Vitals.
Fix it: Start with the biggest file, usually the hero image. Vodafone’s team resized the hero image, optimized its SVGs and PNGs, and moved a widget from client-side to server-side rendering so less JavaScript blocked the page. Then audit your scripts: every chat widget, tag and tracking pixel added over the years costs load time.
10. Design for the phone first
In Unbounce’s data, 83% of analyzed visits happened on mobile, and desktop converted 8% better than mobile. So most of your visitors see the phone version, and on average it converts worse.
Shoppers in Black Friday week are on their phones too. Adobe reported that mobile drove 57.5% of Cyber Monday 2025 online sales, or $8.2 billion of $14.25 billion.
Check it: Open the page on a real phone, with one hand. Can you read the headline, see the CTA and tap it without zooming?
Fix it: Design the phone layout first, then scale up. Shorten the headline, give buttons room to tap, and don’t let pop-ups cover the form.
11. Fix tracking before you spend
If you can’t tell which ad produced which conversion, you can’t tell whether the page works. You also can’t prove that a fix helped.
Check it: Submit a test conversion yourself, then look for it in your analytics tool and in your ad platform. Does it show the right source, campaign and page?
Fix it:
- Define one primary conversion for the page and report that as the headline number.
- Use consistent UTM tags on every ad link so campaigns don’t scatter across “direct” and “other.”
- Track the steps before the conversion, like button clicks and form starts, so you can see where people drop off.
- Re-test after every page change, because edits can break tags quietly.
- Pick one source of truth for decisions. Ad platforms and analytics tools rarely match exactly.
12. Queue a test, then let it run
The last fix is a habit. NP Digital’s survey of 100 companies with at least $10M in annual revenue found that revenue growth rose with test volume, then leveled off:
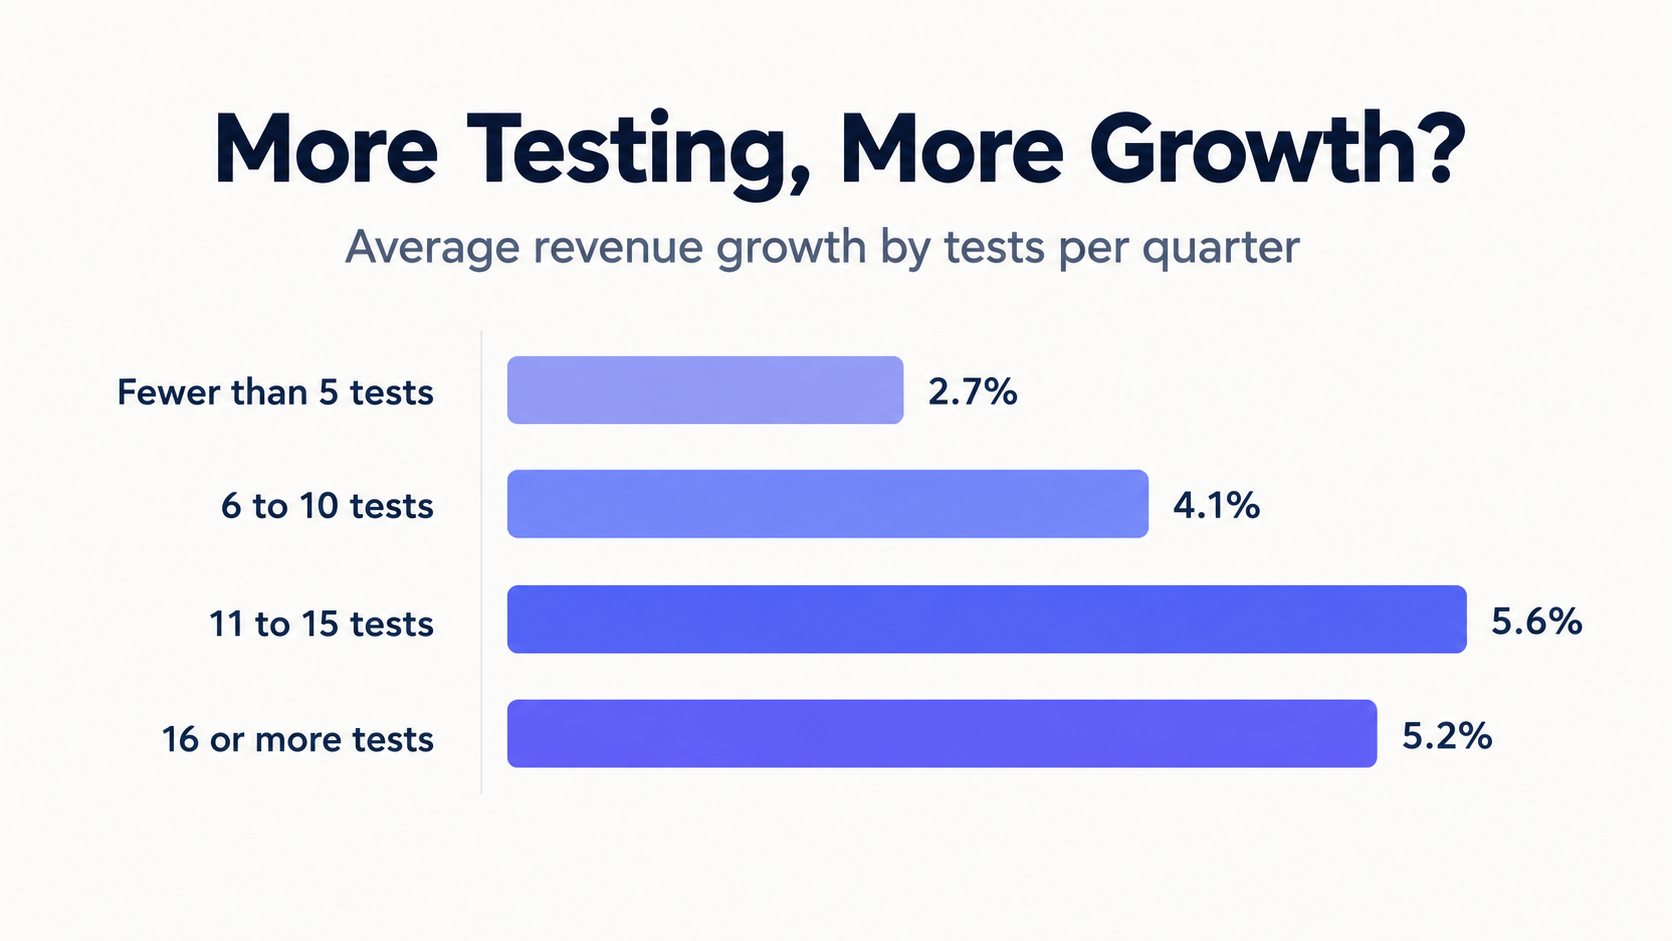
The page doesn’t explain how growth was measured, and a correlation isn’t proof that testing caused it. Companies at that revenue level also likely have the traffic to run that many tests. A smaller site may only support a few. The point is the habit of always having the next test ready.
Check it: Do you have a test with a hypothesis, one primary metric and an end date?
Fix it: Change one thing at a time. Write down the hypothesis, the metric and when you’ll stop before you launch. Run it in full weeks so weekday and weekend behavior both show up, and don’t call it early because one variant jumped ahead. Check the result with an A/B test calculator, ship the winner and queue the next test.
FAQs
What is a landing page audit?
It’s a structured check of the page your ads send traffic to, scored against a fixed list of fixes before you increase spend. This guide uses 12: message match, headline, one goal, plain copy, proof, trust, form, exits, speed, mobile, tracking and testing.
What is a good landing page conversion rate?
In Unbounce’s 2024 benchmark report, the median across industries was 6.6%, and industry medians ranged from 3.8% to 12.3%. By traffic source, the averages were 10.9% for paid search and 19.3% for email. Compare yourself with your own industry and channel.
How often should I do a Landing Page audit?
Before every major campaign, and after any big change to the page, the offer or the traffic source.
Do I need a redesign or just fixes?
Look at which rows failed. If most failures are in rows 1 to 8, the problem is the content and layout, and you can fix it page by page. If they’re mostly in rows 9 and 10, the problem is how the page is built, and a rebuild may be faster than patching.
How long should I run a test?
Decide before you start: one hypothesis, one primary metric and an end date. Run it in full weeks so weekday and weekend behavior both show up.
Conclusion
A landing page doesn’t have to be perfect to beat the median. It has to be clear, trustworthy, fast and measurable. Most pages miss at least one of those before anyone tests them.
Run the scorecard on the landing page you’re about to send traffic to. Fix the quick ones this week, schedule the slower ones, and freeze everything.
If you’d rather hand the fixes to a team, Draftss has been doing this for eight years, with a team of 70 people across design, video, web development and marketing.
Drop your thoughts in the comments below.
Your email address will not be published. Required fields are marked *